
In the world of data warehousing, the way data is structured plays a crucial role in how efficiently it can be queried and analyzed. One of the most widely used and effective data models is the Star Schema. Its simple and intuitive design makes it an ideal choice for analytical queries and business intelligence (BI) applications.
In this blog, we'll explore the concept of the star schema in detail, including its structure, advantages, limitations, and real-world examples. We'll also discuss how it compares to other data models and provide best practices for designing a star schema.
What is a Star Schema?
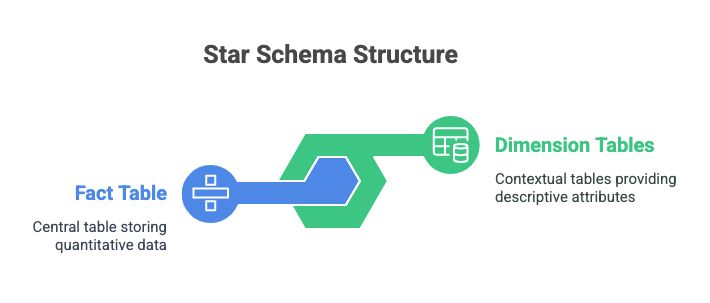
A star schema is a type of database schema that organizes data into two main types of tables:
- Fact Tables – Store quantitative data (metrics) that you want to analyze.
- Dimension Tables – Store descriptive attributes (context) related to the data in the fact table.
The schema is called a "star" because the fact table is placed at the center, and the dimension tables are connected to it, forming a star-like shape when visualized.
Structure of a Star Schema
Fact Table
- Contains measurable, quantitative data (e.g., sales revenue, order quantity).
- Typically holds numeric values that can be aggregated (e.g., sum, average).
- Fact tables have foreign keys linking them to dimension tables.
Dimension Tables
- Contain descriptive information that provides context to the data in the fact table.
- Dimension tables include attributes like date, location, product details, customer information, etc.
- Typically have a primary key that links to the fact table’s foreign key.
Example of a Star Schema
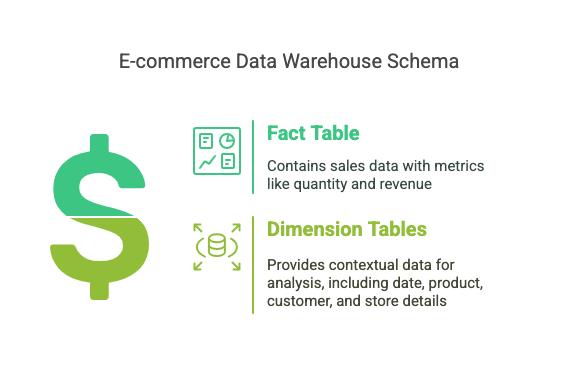
Consider a data warehouse for an e-commerce company that wants to analyze its sales performance. A star schema might look like this:
- Fact Table:
salessale_id,date_id,product_id,customer_id,store_id,quantity,revenue
- Dimension Tables:
date_dim–date_id,date,month,quarter,yearproduct_dim–product_id,product_name,category,brand,pricecustomer_dim–customer_id,customer_name,location,age_group,genderstore_dim–store_id,store_name,city,state,country
Visual Representation:
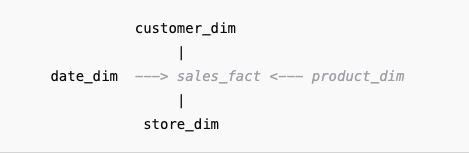
In this example:
- The
sales_facttable contains numeric values likequantityandrevenue. - The
dimension tablesprovide context, allowing business analysts to filter and analyze the sales data based on product, date, customer, and store details.
Advantages of Star Schema
✅ Simple and Easy to Understand
- The structure is easy to visualize and interpret, even for non-technical users.
- Straightforward relationships between fact and dimension tables simplify query writing.
✅ Fast Query Performance
- Star schema supports fast data retrieval because the data is denormalized.
- Joins are simplified since dimension tables are directly connected to the fact table.
✅ Optimized for BI Tools
- Most business intelligence (BI) tools like Tableau, Power BI, and Looker are designed to work well with star schemas.
- Aggregate queries are faster and more efficient due to fewer joins.
✅ Scalability
- Star schema can handle large volumes of data.
- New dimension tables can be added without affecting existing queries.
Limitations of Star Schema
❌ Data Redundancy
- Dimension tables can have repeated data due to denormalization, increasing storage requirements.
- Example: If the same product appears in multiple sales records, its details will be duplicated in the
product_dimtable.
❌ Lack of Flexibility for Complex Relationships
- Star schema is not ideal for representing complex relationships between data entities.
- Example: If products are associated with multiple suppliers, it becomes challenging to model that in a star schema.
❌ Data Integrity Issues
- Since data is denormalized, updating records consistently across multiple tables can lead to data integrity issues.
- Example: If a product's price changes, updating it consistently across multiple tables may require additional effort.
Star Schema vs. Snowflake Schema
| Feature | Star Schema | Snowflake Schema |
|---|---|---|
| Structure | Single-level, denormalized tables | Multi-level, normalized tables |
| Query Performance | Fast due to fewer joins | Slower due to more complex joins |
| Storage | Requires more storage due to redundancy | Requires less storage due to normalization |
| Complexity | Simple and easy to understand | More complex due to hierarchical relationships |
| Use Case | Best for simple queries and fast performance | Best for complex queries and reducing data redundancy |
Best Practices for Designing a Star Schema
1. Keep Fact Tables Narrow
- Store only essential numeric metrics in fact tables.
- Minimize the number of foreign keys to keep queries efficient.
2. Use Surrogate Keys
- Use integer-based surrogate keys in dimension tables instead of natural keys.
- Surrogate keys improve join performance and simplify data consistency.
3. Maintain Consistent Granularity
- Ensure that all data in a fact table is at the same level of detail (granularity).
- Example: If the fact table contains daily sales data, all dimensions should align with this level of detail.
4. Avoid Null Values in Fact Tables
- Null values can affect aggregation and query performance.
- Replace nulls with default values or zeroes where applicable.
5. Pre-Aggregate Data Where Possible
- To improve query performance, create aggregate tables for frequently used combinations of dimensions and measures.
Real-World Example of Star Schema
🎯 Retail Industry
A large retail chain may use a star schema to analyze sales performance across stores and products.
Fact Table:
sales_fact– total revenue, total quantity, profit margin
Dimension Tables:
product_dim– product name, category, pricestore_dim– store location, store sizedate_dim– day, month, year, quarterpromotion_dim– promotion name, discount rate
Business analysts can easily generate insights such as:
- Total sales by store location
- Best-selling products by category
- Monthly profit margin trends
🎯 E-Commerce Platforms
An e-commerce platform like Amazon may use a star schema to track customer behavior, order history, and product performance.
- Fact Table:
order_fact– order value, shipping cost, tax amount - Dimension Tables:
customer_dim,product_dim,shipping_dim,payment_dim
Insights:
- Average order value by customer segment
- Most profitable product categories
- Shipping costs by region
Challenges and How to Overcome Them
🔹 Challenge: Large Dimension Tables
Solution: Partition large dimension tables based on business needs (e.g., by region or date).
🔹 Challenge: Slow Queries Due to Data Volume
Solution: Create materialized views or pre-aggregated tables to improve query speed.
🔹 Challenge: Data Integrity Issues
Solution: Implement ETL (Extract, Transform, Load) processes with strict validation rules.
Conclusion
The star schema remains one of the most effective data models for analytical and reporting purposes. Its simple structure, fast query performance, and compatibility with BI tools make it an ideal choice for data warehousing in industries like retail, e-commerce, and finance. While it has some limitations, careful design and best practices can help overcome these challenges.
By understanding the strengths and weaknesses of the star schema, businesses can build scalable and efficient data warehouses to drive meaningful insights and make informed decisions.


